Resources
Here I compile a list of some helpful resources/tips (created by me or others) that have helped me in the past years. Contributions are more than welcome!
Topics: 💻 Code 📊 Design 👾 Apps
Code
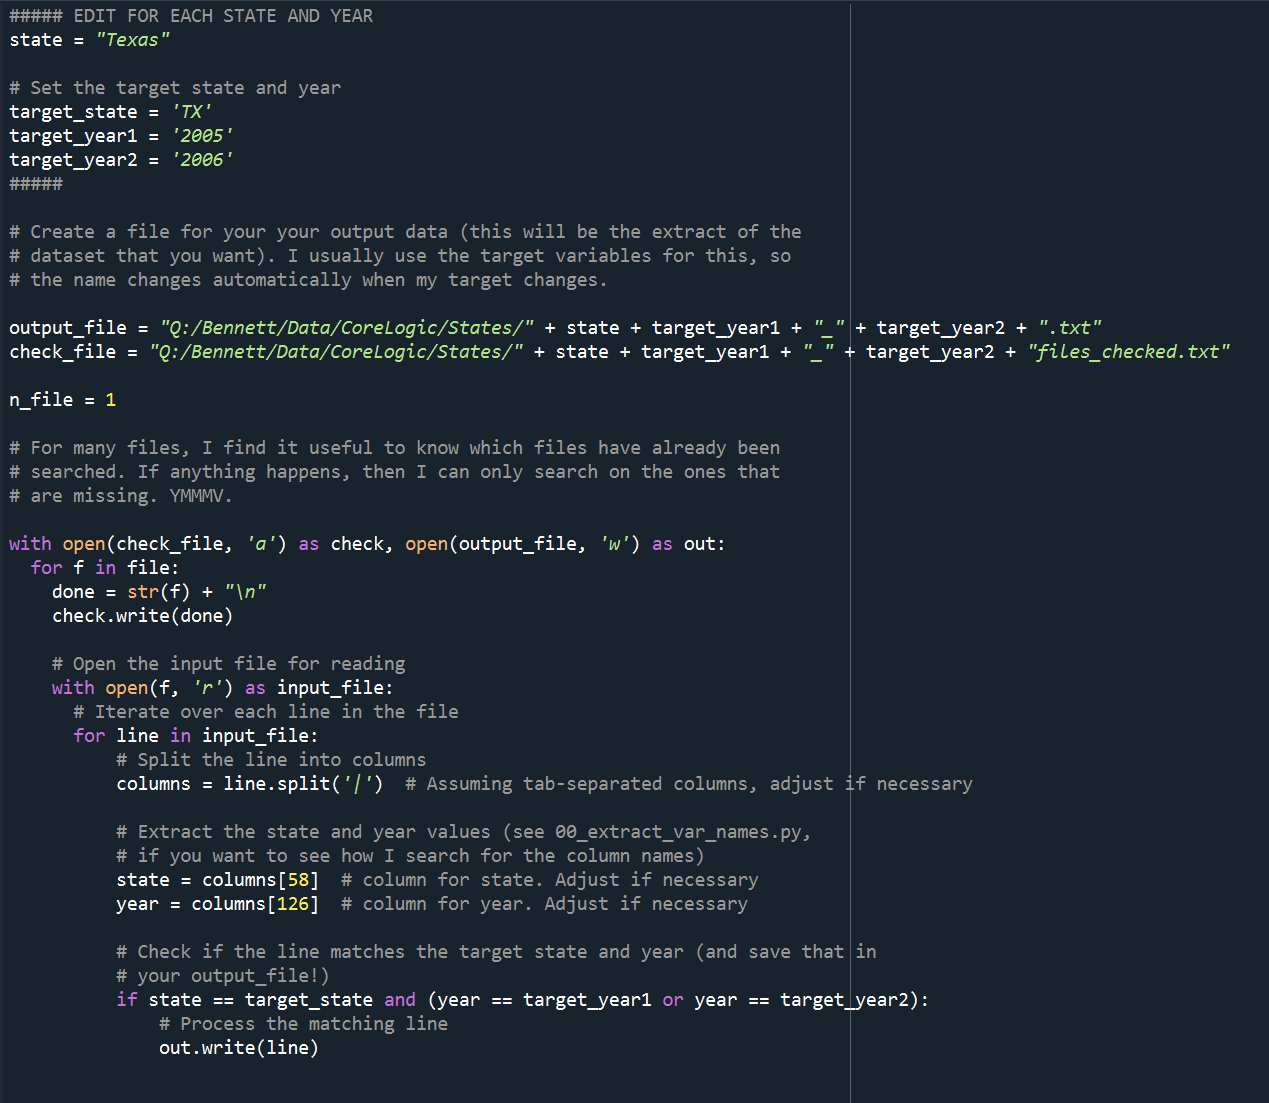
That’s a lot of data
I’m sure everyone (?) has run into the problem of having a dataset that is too large to open in memory. Don’t worry! There are many standard ways that you can solve this. Here I show how to do this in Python. Nothing revolutionary, but it helps a lot when you have huge data and you only need to extract a specific chunk (e.g. state or year, or both). I illustrate this with the CoreLogic data, but you can adapt it as you wish. Just follow the comments in the script and you should be good to go!
Who doesn’t like stickers?
Not me. I love stickers. Specially nerdy ones (RedBubble can attest to that). So, I decided to create some to keep my students motivated. I thought they were cool, so I am putting them out in the world. Disclaimer: The jokes are not mine (I’m not that funny in English)
Here’s an example of these cool stickers (I’ll be uploading more during the semester):


Who cites me?
Mirya Holman posted the following tweet, and I thought it was a super interesting question. Who do I cite and who cites me?
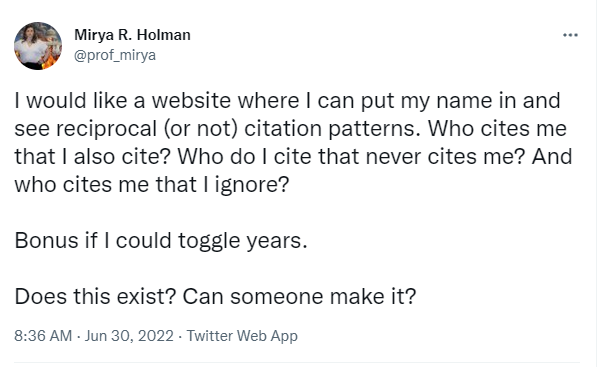
For that reason, I started looking around whether there was something that did this at the researcher level and not the article level. I wasn’t able to find anything that did exactly this, so I thought it was a good opportunity to try to code this. Using SerpAPI, I wrote the following Python code to scrape Google Scholar and find who is citing my (or other author’s) paper. You will need to get an API key from SerpAPI, but they have a free plan.
So far, I only have one side of the network. I will update this then to find who an author cites, creating the full network of reciprocity by year.
PS: By the way, Mirya’s newsletter is 🔥. You can (and should) sign up here
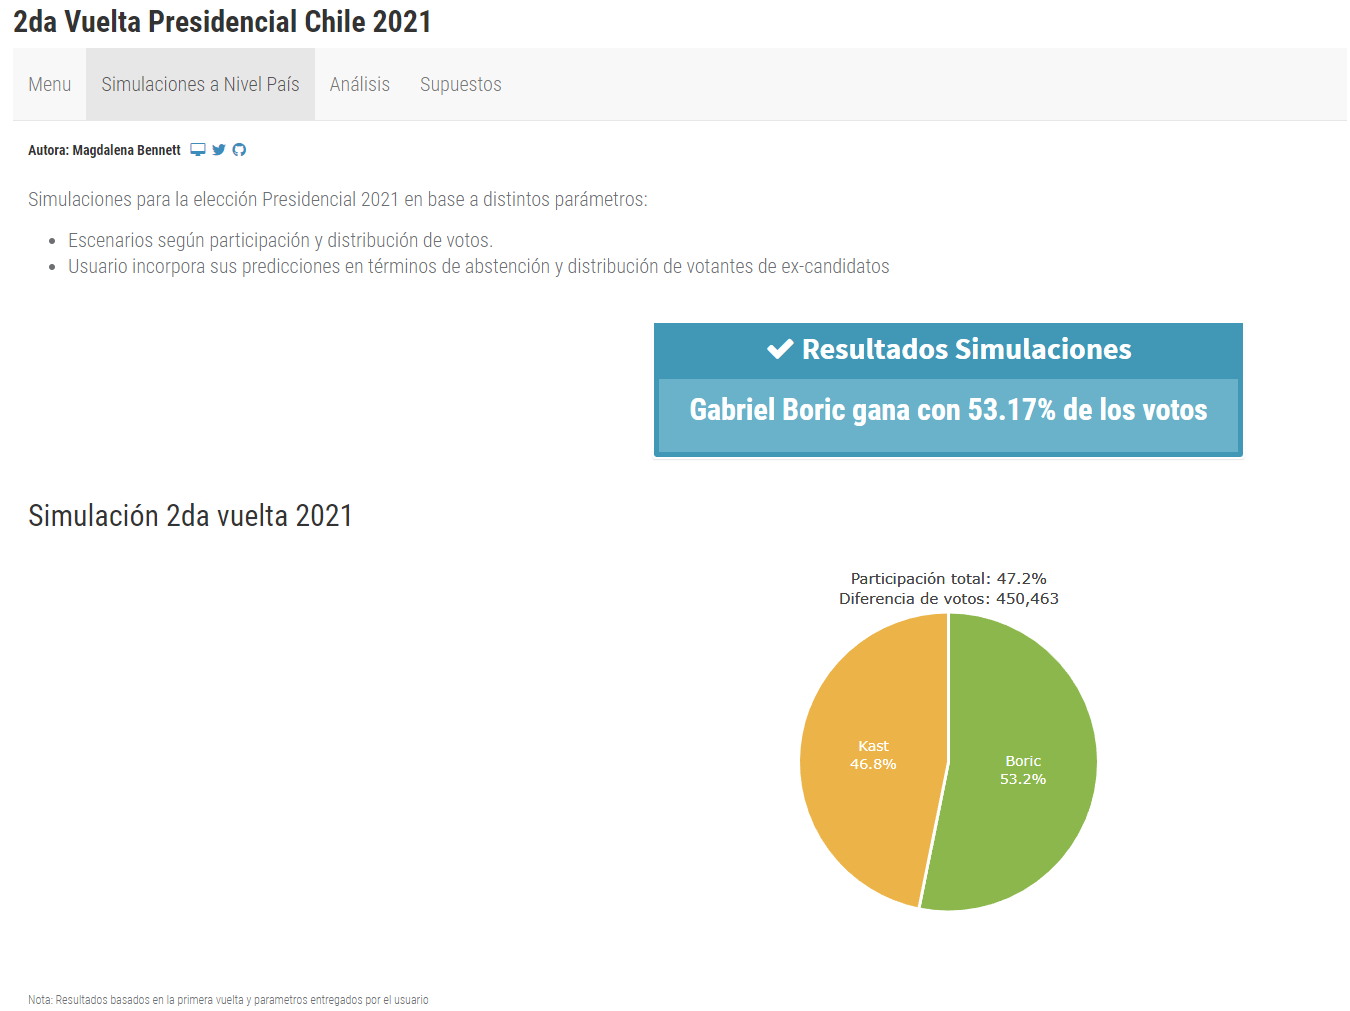
How is the 2nd ballot going to turn out in the Chilean presidential election?
I created a simple shinyapp to play around with different scenarios for the second round of the presidential election in Chile 2021 (website in Spanish). You can see the live app here, and check out the code in my repository.
Easy way to scrape some data in R
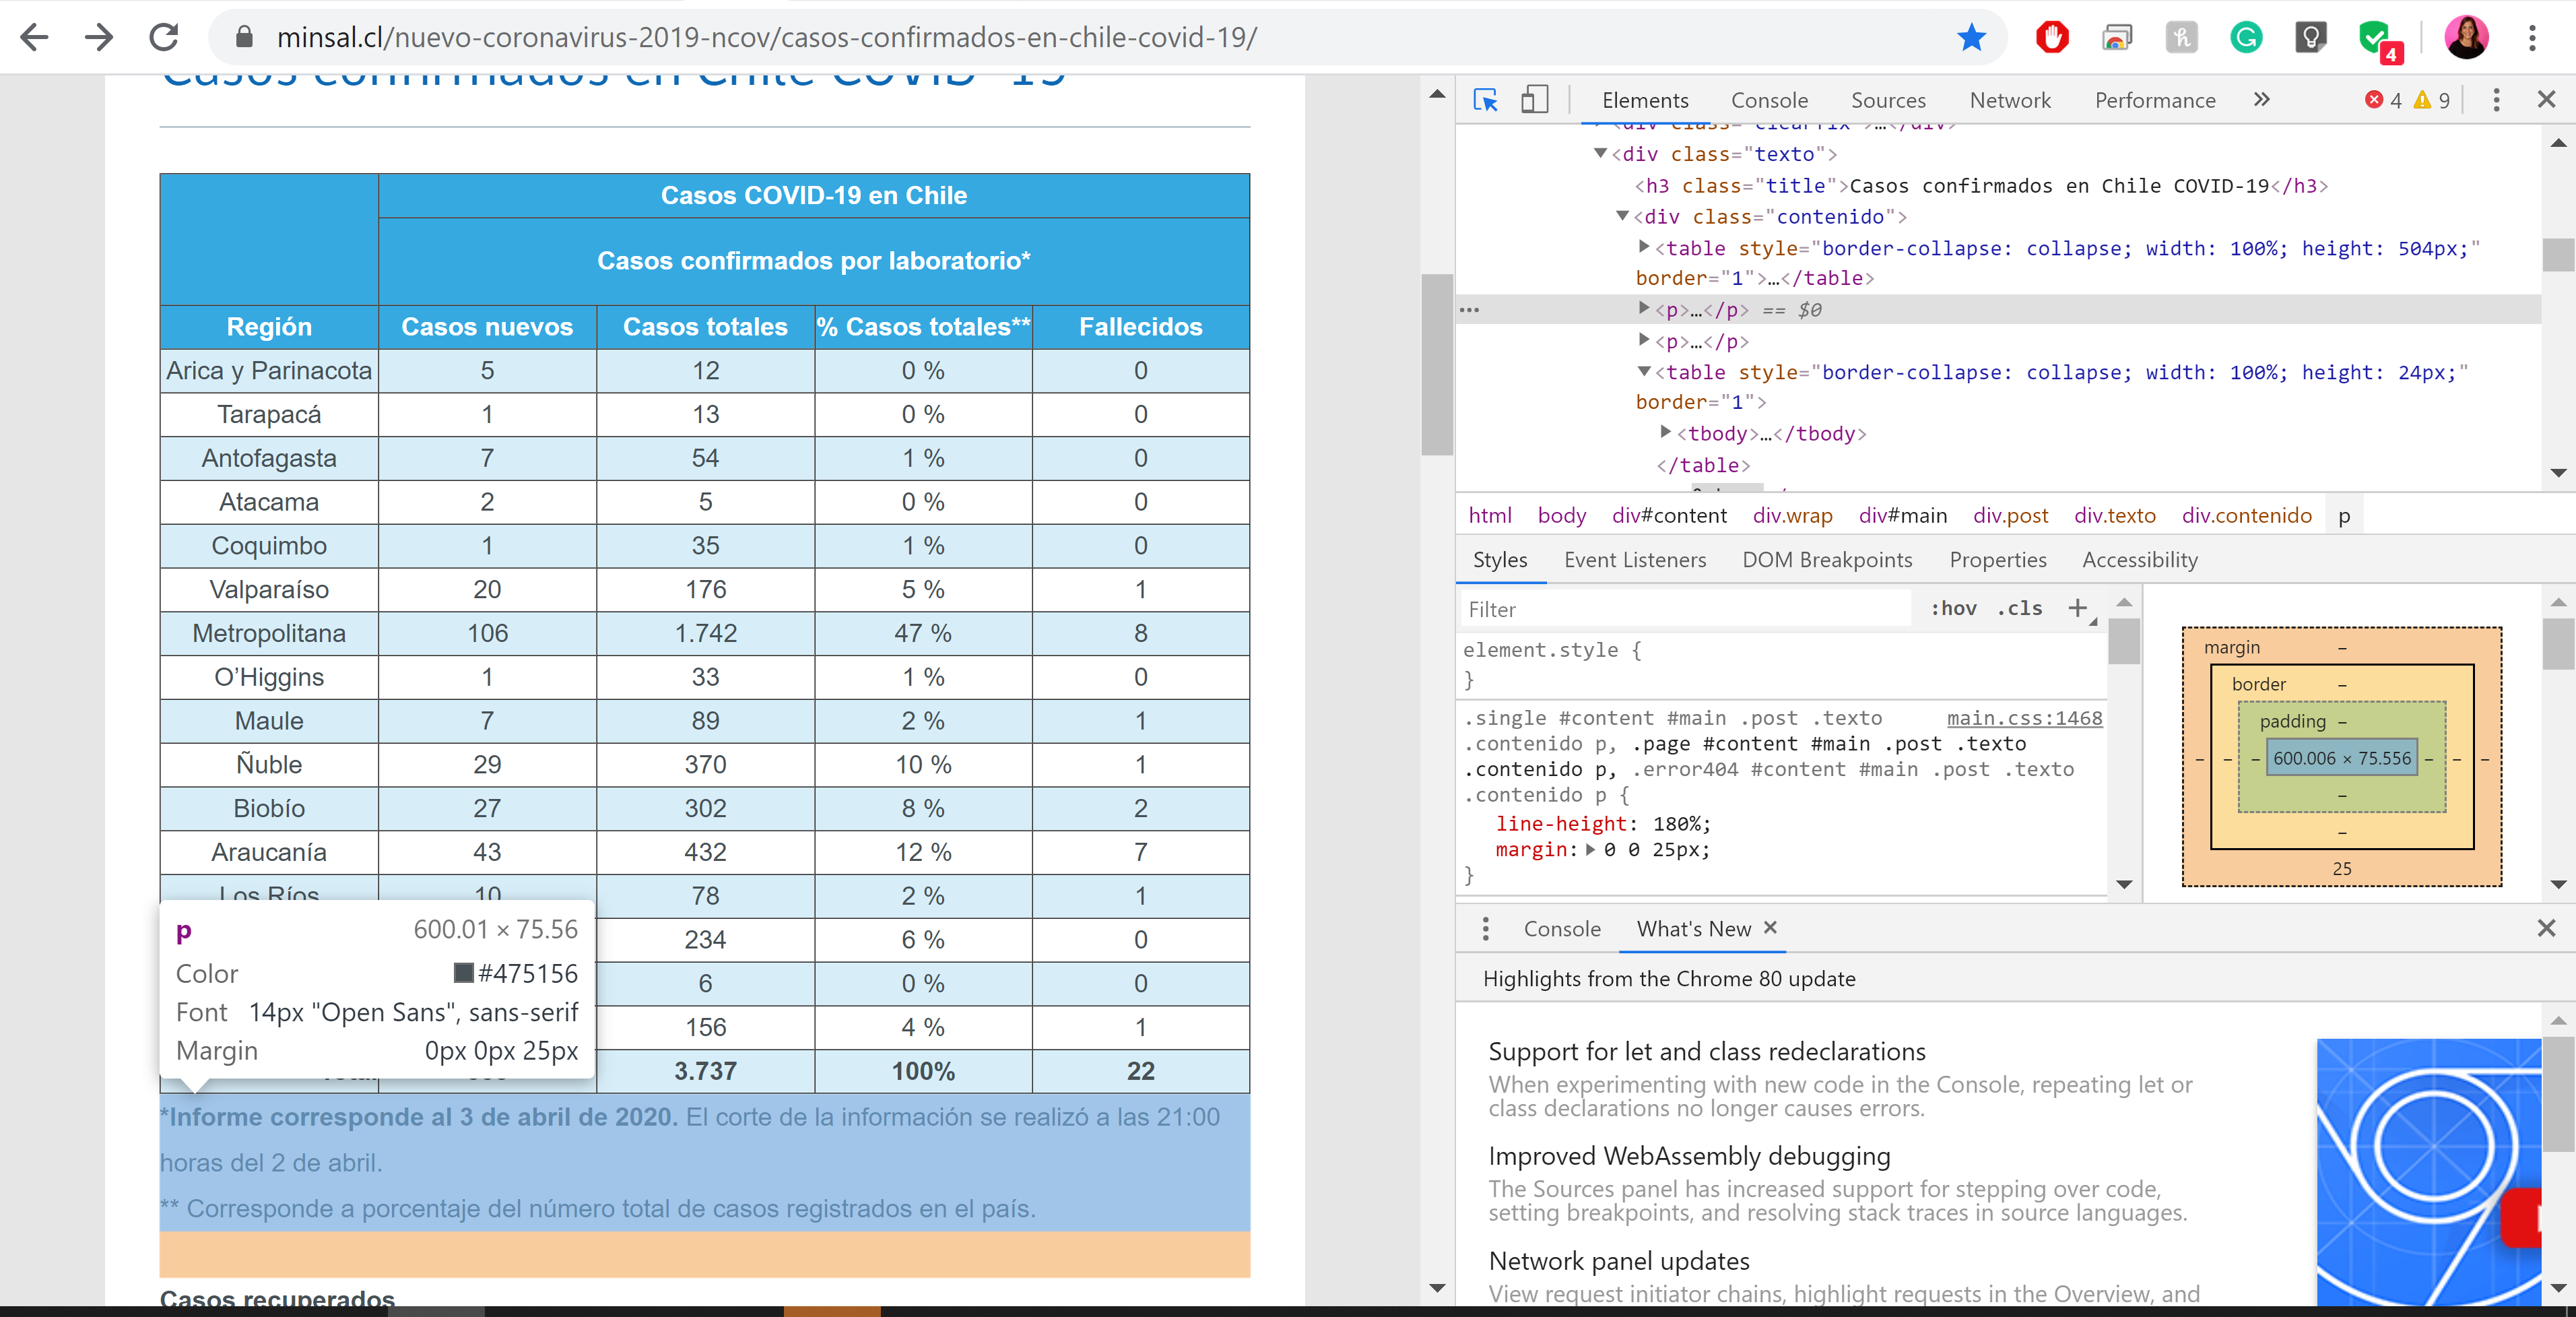
This code was posted by Sue Marquez for scraping some COVID-19 data, and I found it super useful. I am fairly new at scraping data, and this made it very easy and intuitive. The main advantage is that by using Inspect on your browser, you can see exactly the different content you want to scrape and download. I slightly adapted Sue’s code for scraping data from the Chilean Ministry of Health, and commented it so you know how to adapt it for your own needs. Check it out here.
R script for doing quick maps
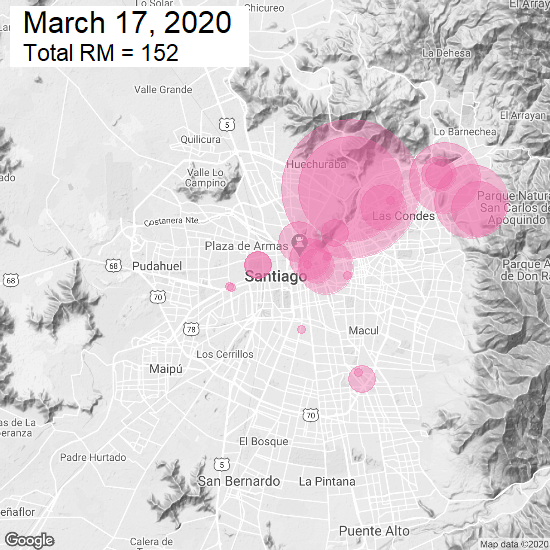
This can be used in combination with the geocode Rscript that’s down below, but here’s a quick way to visualize some locations in R. I illustrate this with the specific case of the spread of #COVID-19 in Chile. I download a map from Google into R (you will need an API key for this, so check out this website), and then plot the locations of the detected cases. In this case, I make the size of the points proportional to the number of cases detected in that center. You can check out the end results here or the full repository here, including the code and data.
Python script for ArcGIS to characterize geographic zones with census tract data
Sometimes we need to characterize certain geographic zones (e.g. school districts) with geographic data that is in a different level (e.g. census tract data). How do we do that? Here I have some example code on how to create a csv file using a Python script that can be run in ArcGIS. The idea is that by combining both levels of geographic data, we can later create weights for our areas of interest depending on the overlapping surface of other geographic areas. The code sets an example using Florida school districts and census tracts, and merges tract level income data (you can merge way more census tract data!). The Python code is first run in ArcGIS, and the analysis is later conducted in Stata for simplicity. The example map below shows Collier County School district in FL and the overlapping census tracts:
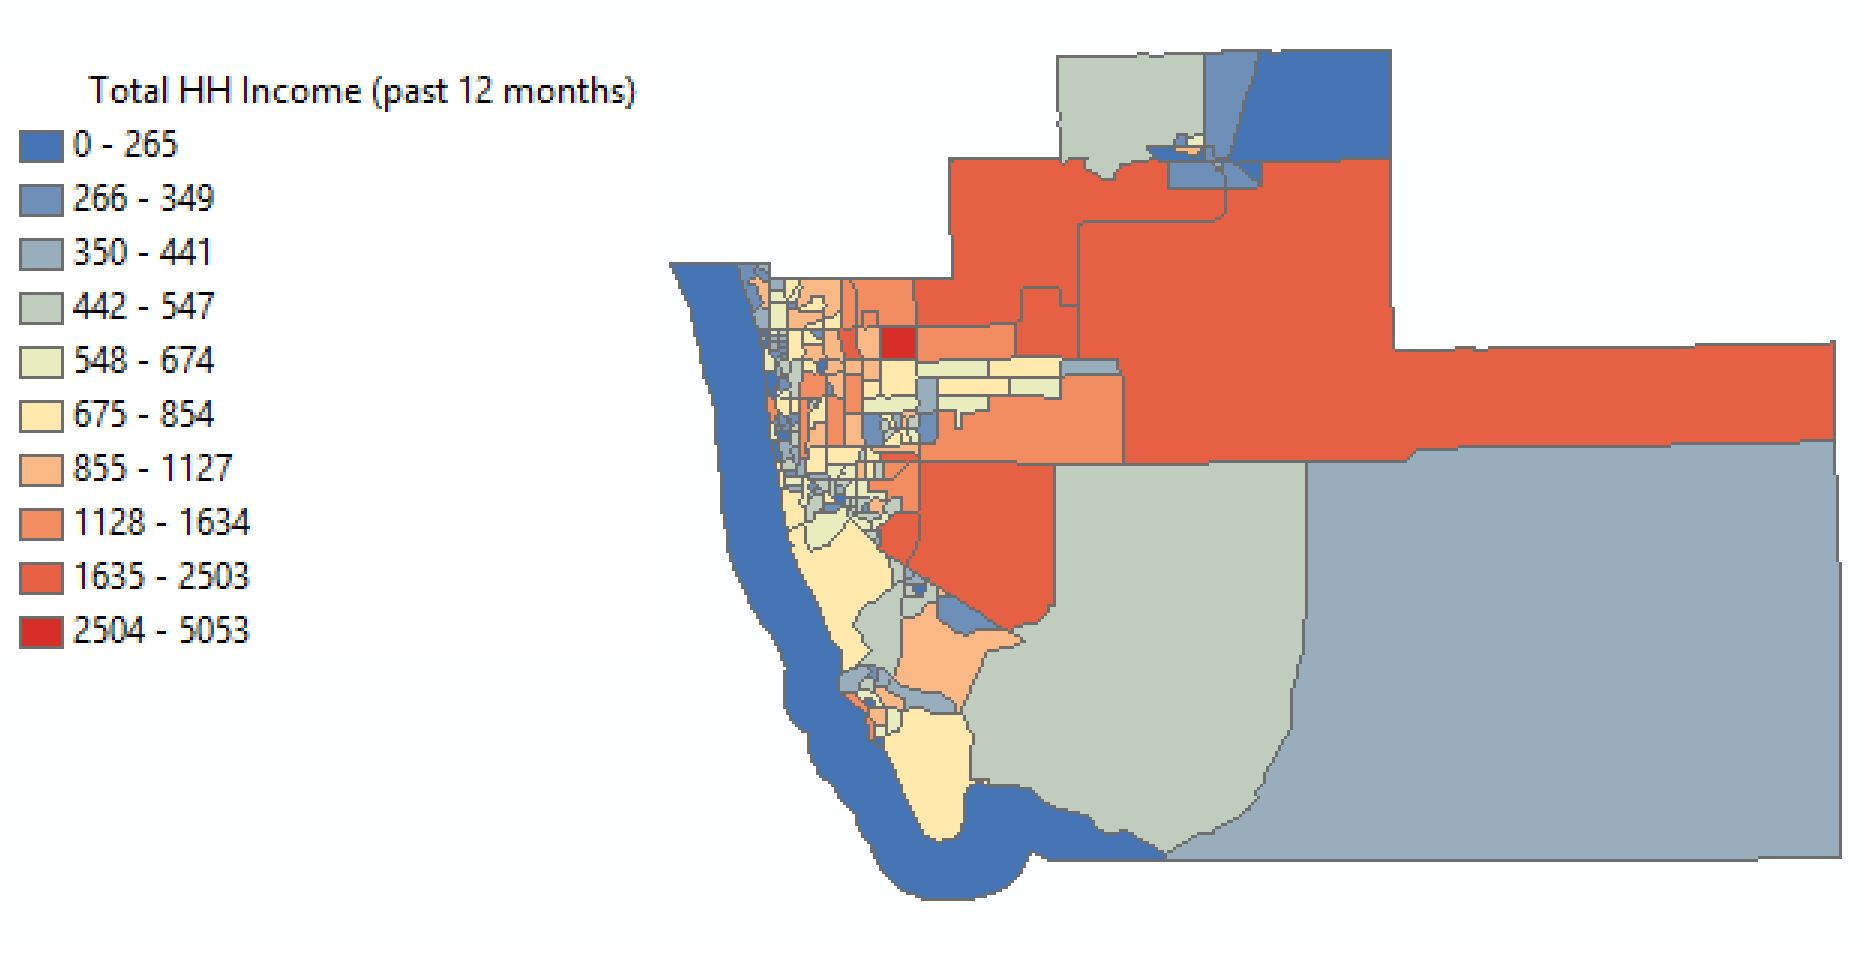
If we wanted the average household income for the district using the census tract data, we can generate a weighted average of the overlapping census tracts.
Stata dofile for LaTeX output
If you are like me, and want to fully personalize everything in your LaTeX output, there’s nothing better than creating your own table in a dofile instead of using an out-of-the-can package. You can do it by using texdoc and writing your table from scratch using macros. Might sound like more work (it is), but it can also be pretty easy for getting that output just as you wanted. You can download a simple example dofile here.
(Credits due to @AndresGonzLira who showed me this command back in 2012 at JPAL LAC).
Need to geocode or reverse geocode?
If you ever needed to go from lat/lon to addresses (or vice versa), then this code might come in handy. The geocode (going from street addresses to latitudes and longitudes) and reverse geocode (the opposite) R script I present here was adapted from the code by Kei Saito, and I adapted it to my needs (including geocoding). Be aware that you will need a Google API Key for this (which is easy to get here), and you will get charged if you go over the number of requests you are allowed, which go up to 40,000 requests with the free $200 credit/month (terms have been changing lately, so keep up to date with that). The code also includes a variable that actually counts how many valid requests you have made, so you can keep that in mind when running this! You can find the code here.
PS: You can also easily adapt this code to use Open Street Map (OSM) instead of the Google API, if you want. However, keep in mind that OSM does cap the number of requests significantly compared to Google.
Send a message to your phone when your code is done!
UPDATE: As of January 2024, I feel like Twilio has become quite cumbersome for a small project like this, so I’ve changed my system to now send me a push notification to my phone. If you still want to send a text message, read the second sub-section her, where I show how to do this with Twilio.
Push notification
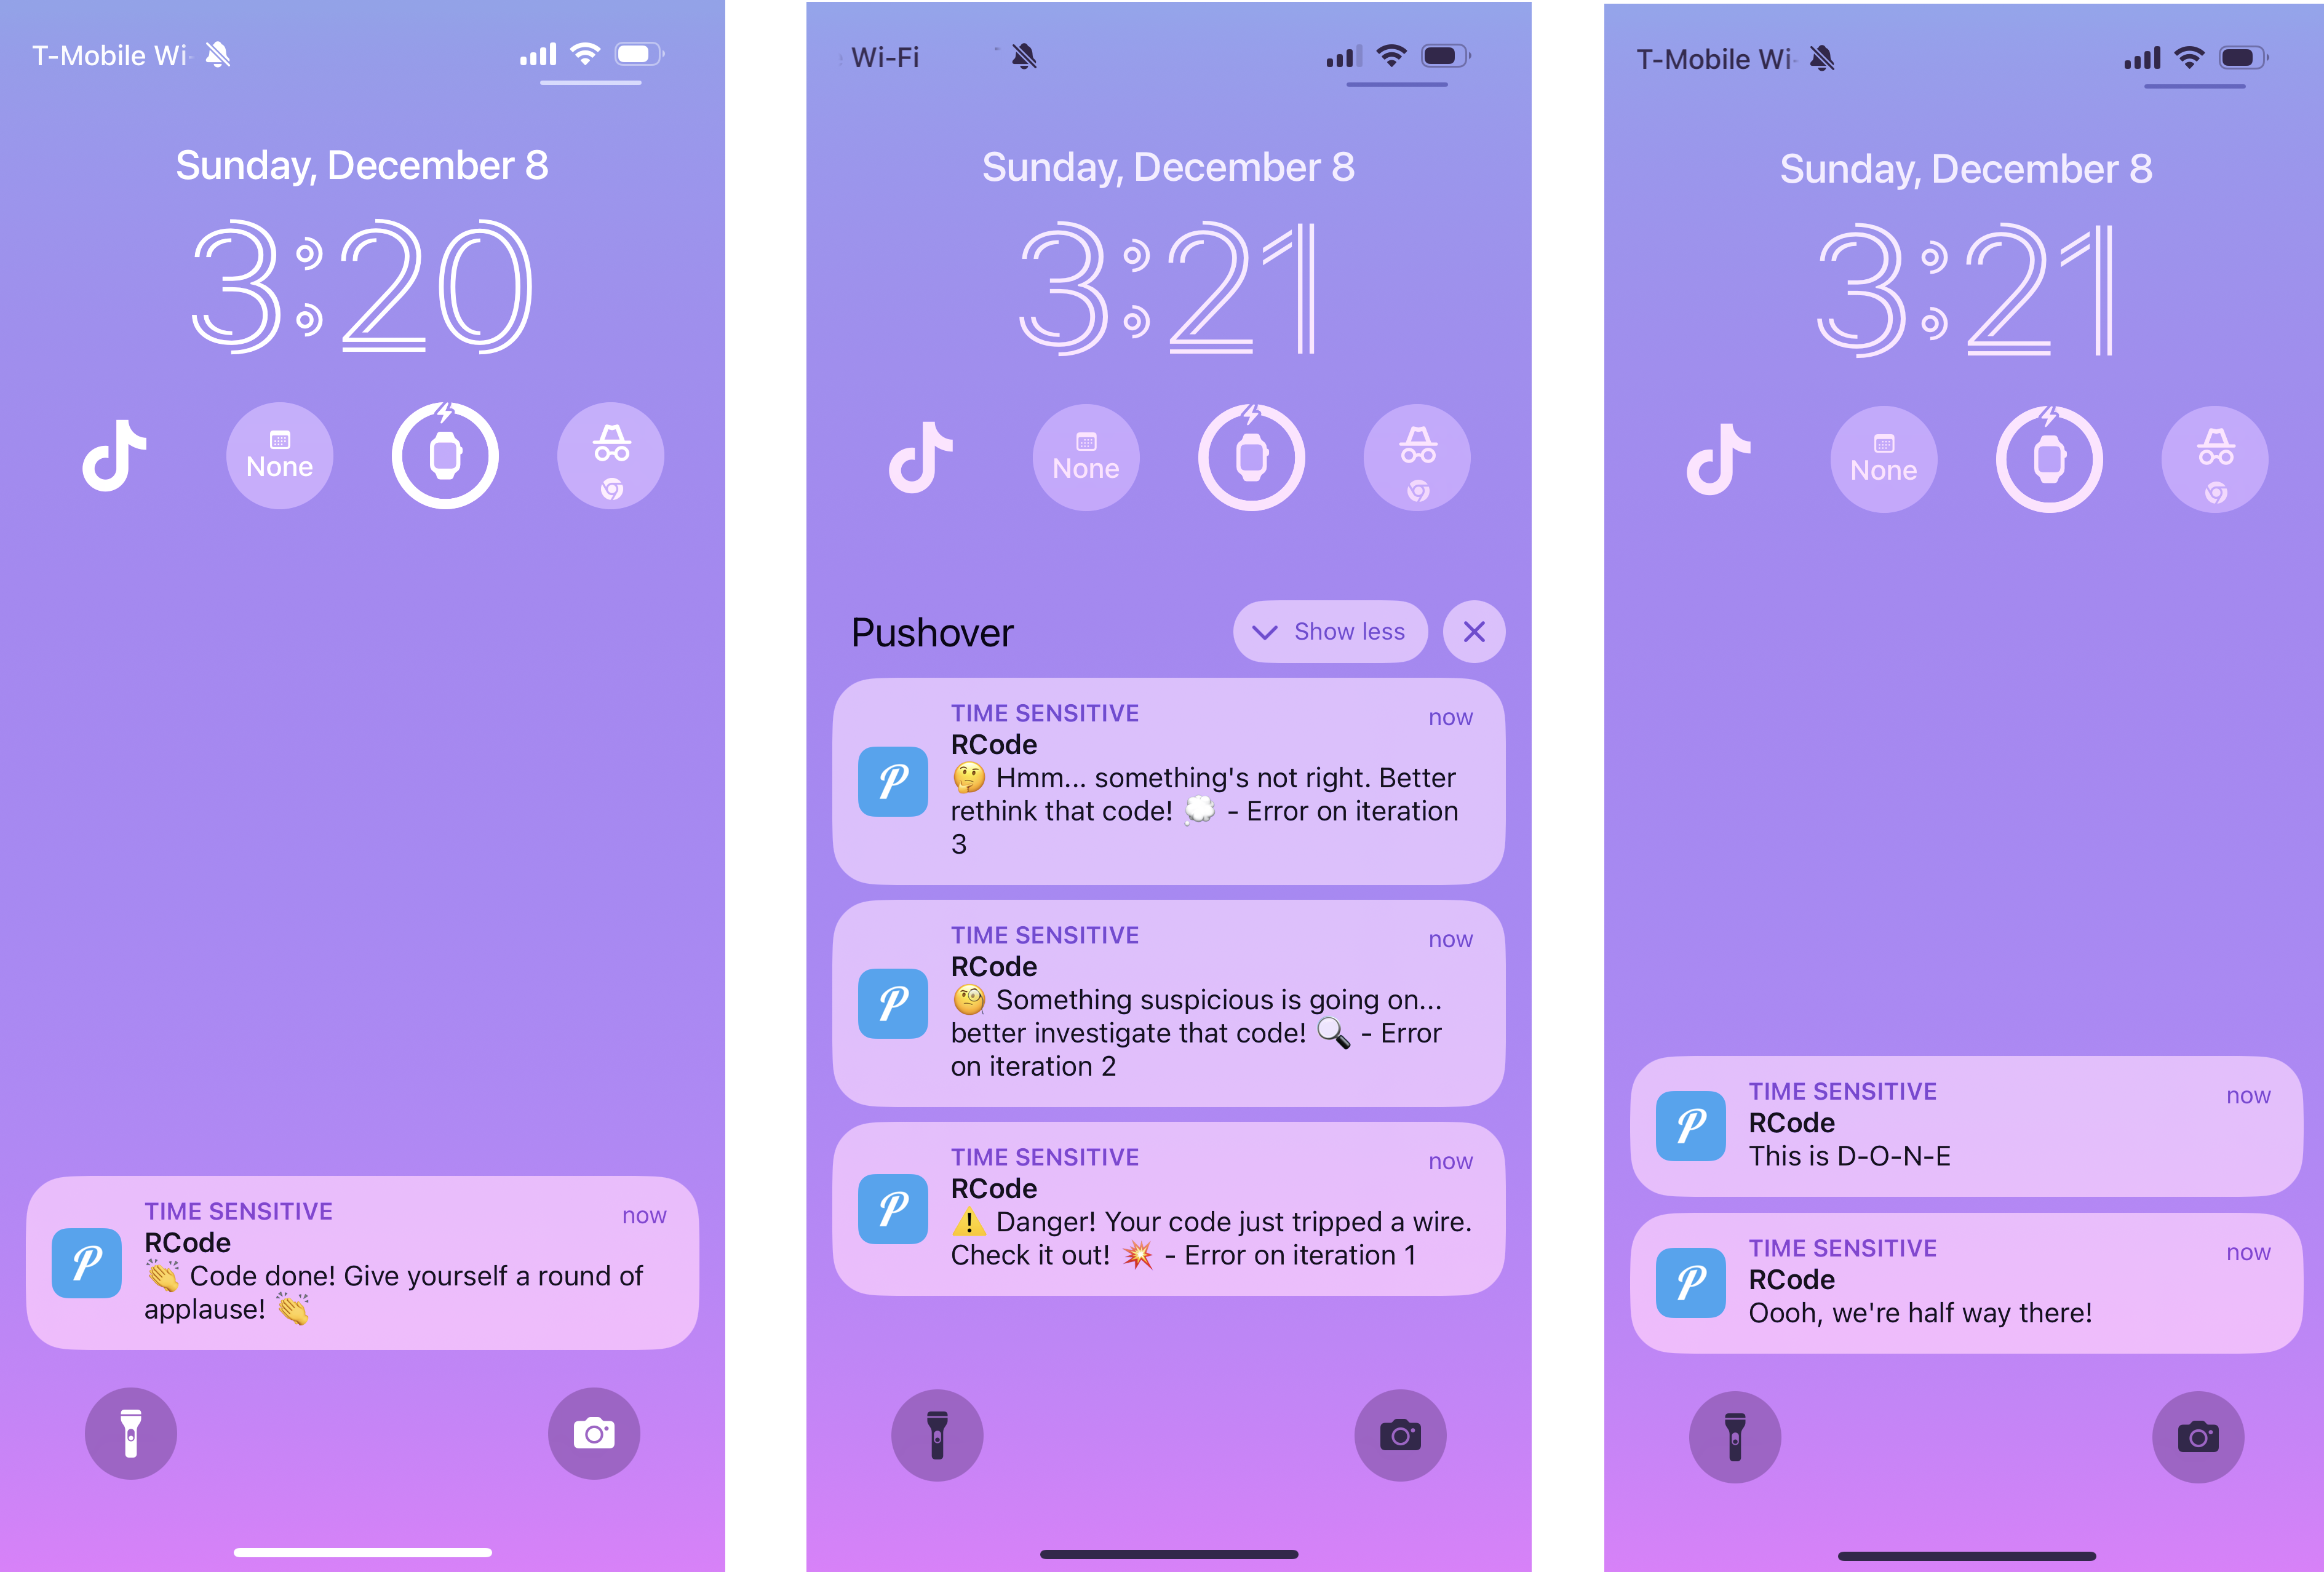
Using the pushover app on your phone, you can easily send push notifications when you’re done, and it’s basically free (PS: You do have to pay a one-time license fee of $4.99, but I feel it’s worth it). So how do we do this? Download the app pushover on your phone, and create an application (it’s super intuitive, but use a name that makes sense for the notification – e.g. “RCode”). When you have that, you can retreive the Pushover User Key and Token Key (for the application).
To make this easier, I created the R package pushme – which is a wrapper package for pushoverr – to send random, upbeat messages about your code. Go check out the GitHub repo for detailed instructions, but basically, you will be able to customize your messages depending on the usage (e.g. if it’s an error, if you want to add additional information, etc.) using the main function pushme().
Some examples of the messages that you can create are the following:
Text message
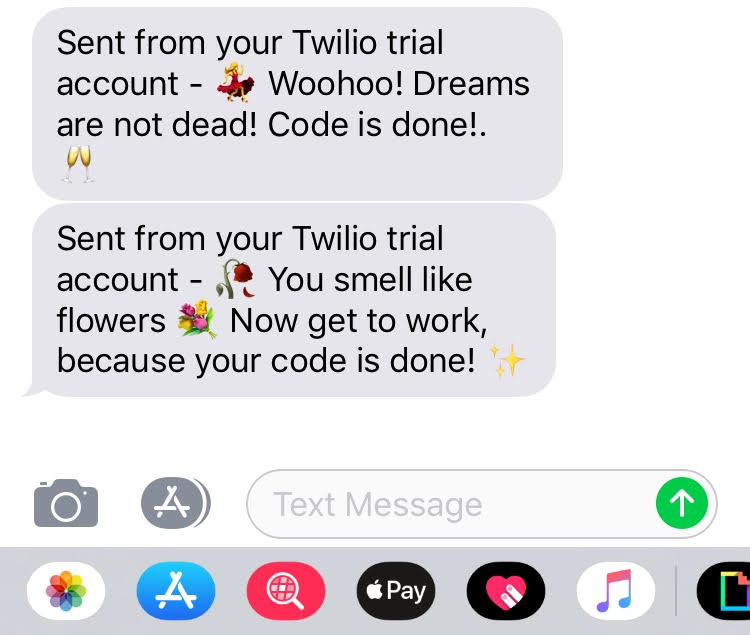
This is some code that @RichPauloo created and tweeted about, and you can find here. If you have ever been running code that takes forever (e.g. a lot of simulations), you might have dreamt of something like this. I implemented it as soon as he tweeted about it: It works great, and its super easy to incorporate to your R code. You will have to set up a Twilio account, but it’s no fuzz. For changing the emojis, I found useful to install the emo package (see code above to install it).
I also randomized different messages you could get, just because I thought it was more fun :). Here’s a brief example:
textme <- function(){
  # First you need to set up your accound SID and token as environmental variables
  Sys.setenv(TWILIO_SID = "YOUR_TWILIO_SID")
  Sys.setenv(TWILIO_TOKEN = "YOUR_TWILIO_TOKEN")

  # Then we're just going to store the numbers in some variables
  my_phone_number <- "YOUR PHONE NUMBER"
  twilios_phone_number <- "TWILIO'S PHONE NUMBER"

  #Some messages:
  msg_list = c(paste(emo::ji("dancer"),"So either your code ran smoothly or you just hit a bump. Either way, go check it out!",emo::ji("celebrate")),
               paste(emo::ji("flower"),"You smell like flowers",emo::ji("flower"),"Now get to work, because your code is done!",emo::ji("sparkles")))

  #Choose a random message
  msg = sample(msg_list,1)

  # Now we can send away!
  twilio::tw_send_message(from = twilios_phone_number,
                          to = my_phone_number,
                          body = msg)

}
And that’s it! (PS: You will get the ugly “free trial” message ahead of your own customized message, but you can get rid of that by, you know, paying money).
Design
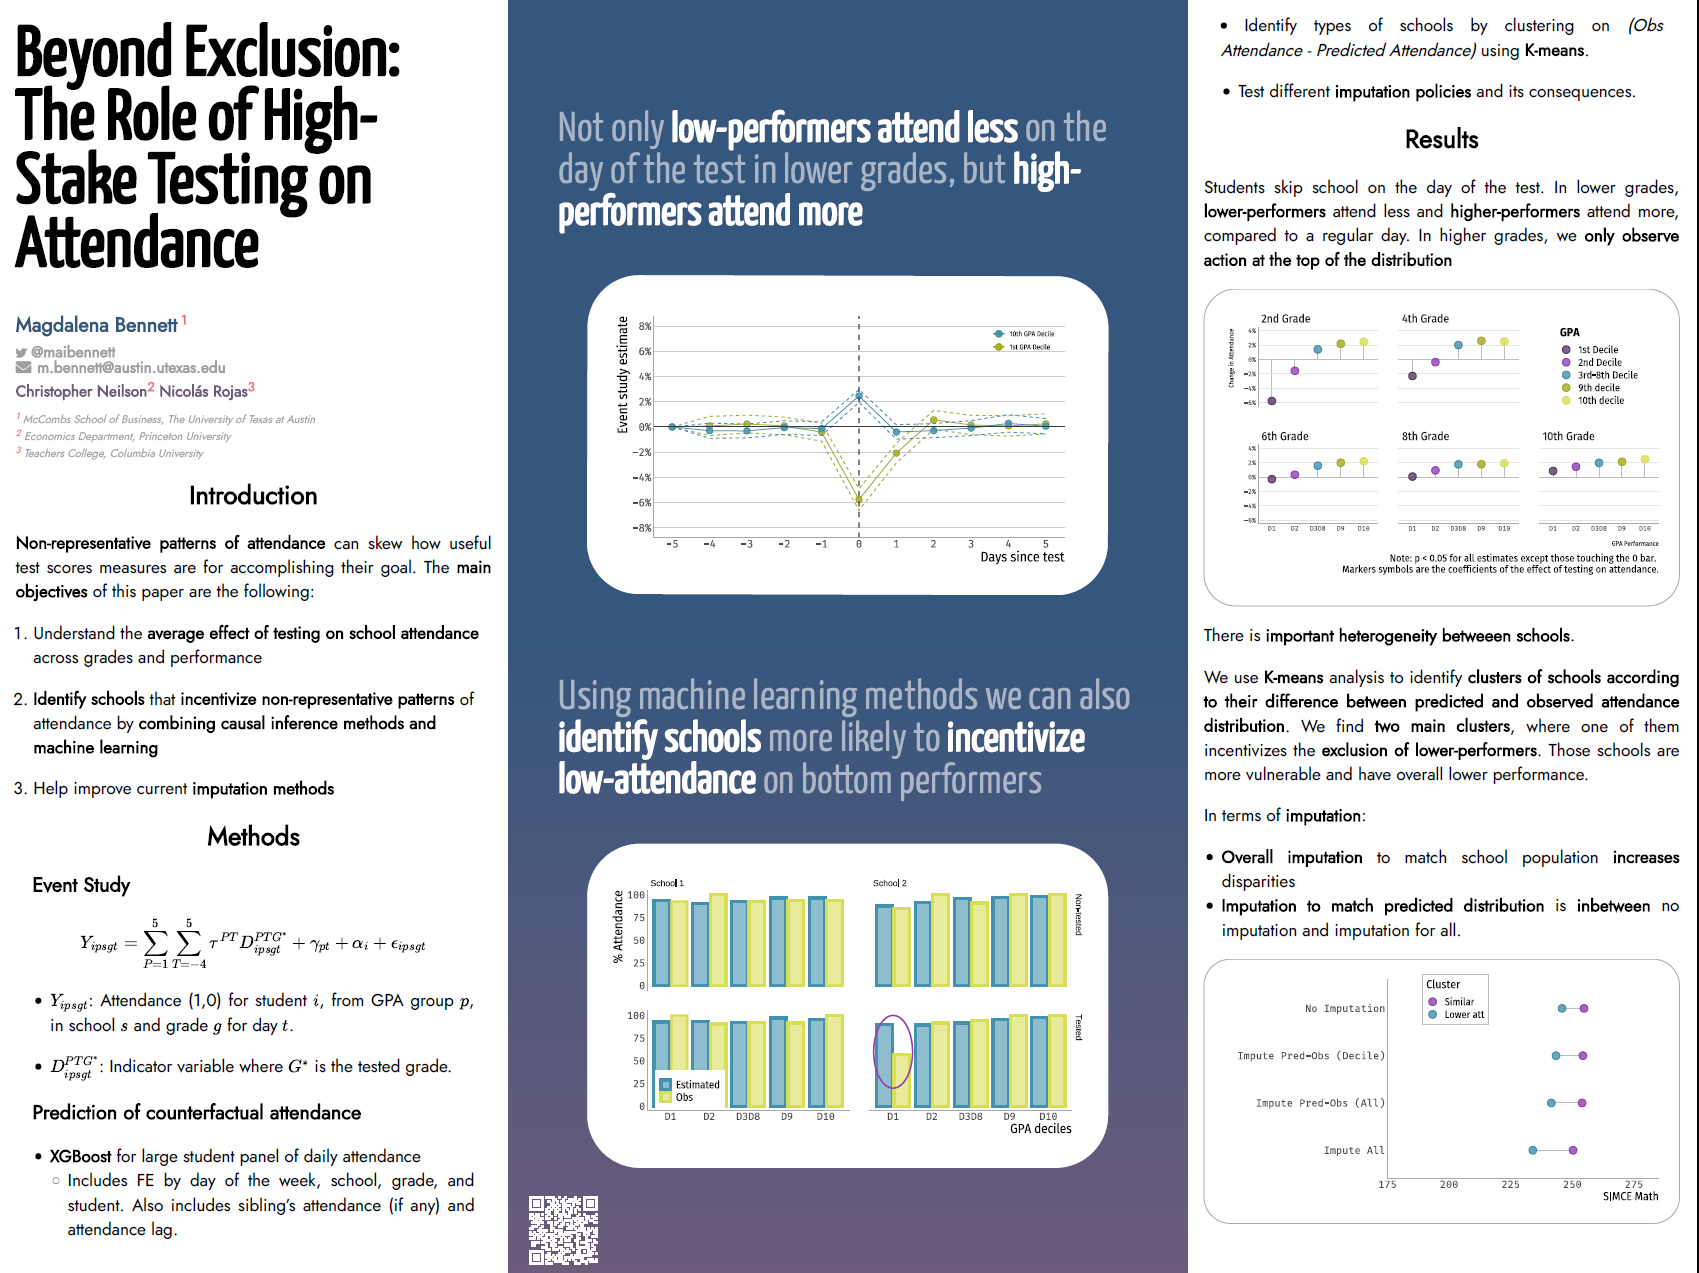
How to make a better poster!
Here’s a video by Mike Morrison on why you should build a better scientific poster (and how to do it):

(tl;dr See the templates here)
I have also found that posterdown works really great to create this type of posters with a beautiful Xaringan feel (see below). If anyone is interested, I created my first poster using that package and adapting the CSS to my needs.
Xaringan #FTW
Lately, I’ve fully moved to Rmarkdown presentations, especifically with Xaringan. These are not only beautiful, but also fully flexible, and way more convenient in the way you can host them. I started a repository of my presentations here, which include both slides and code. I’ll right a longer post about certain resources, but some game changers:
Xaringanthemerhas worked amazing for customizing my slides.- Check out some of Andrew Heiss’ slides. They are #GOALS, and I picked up a bunch of tricks from his available code.
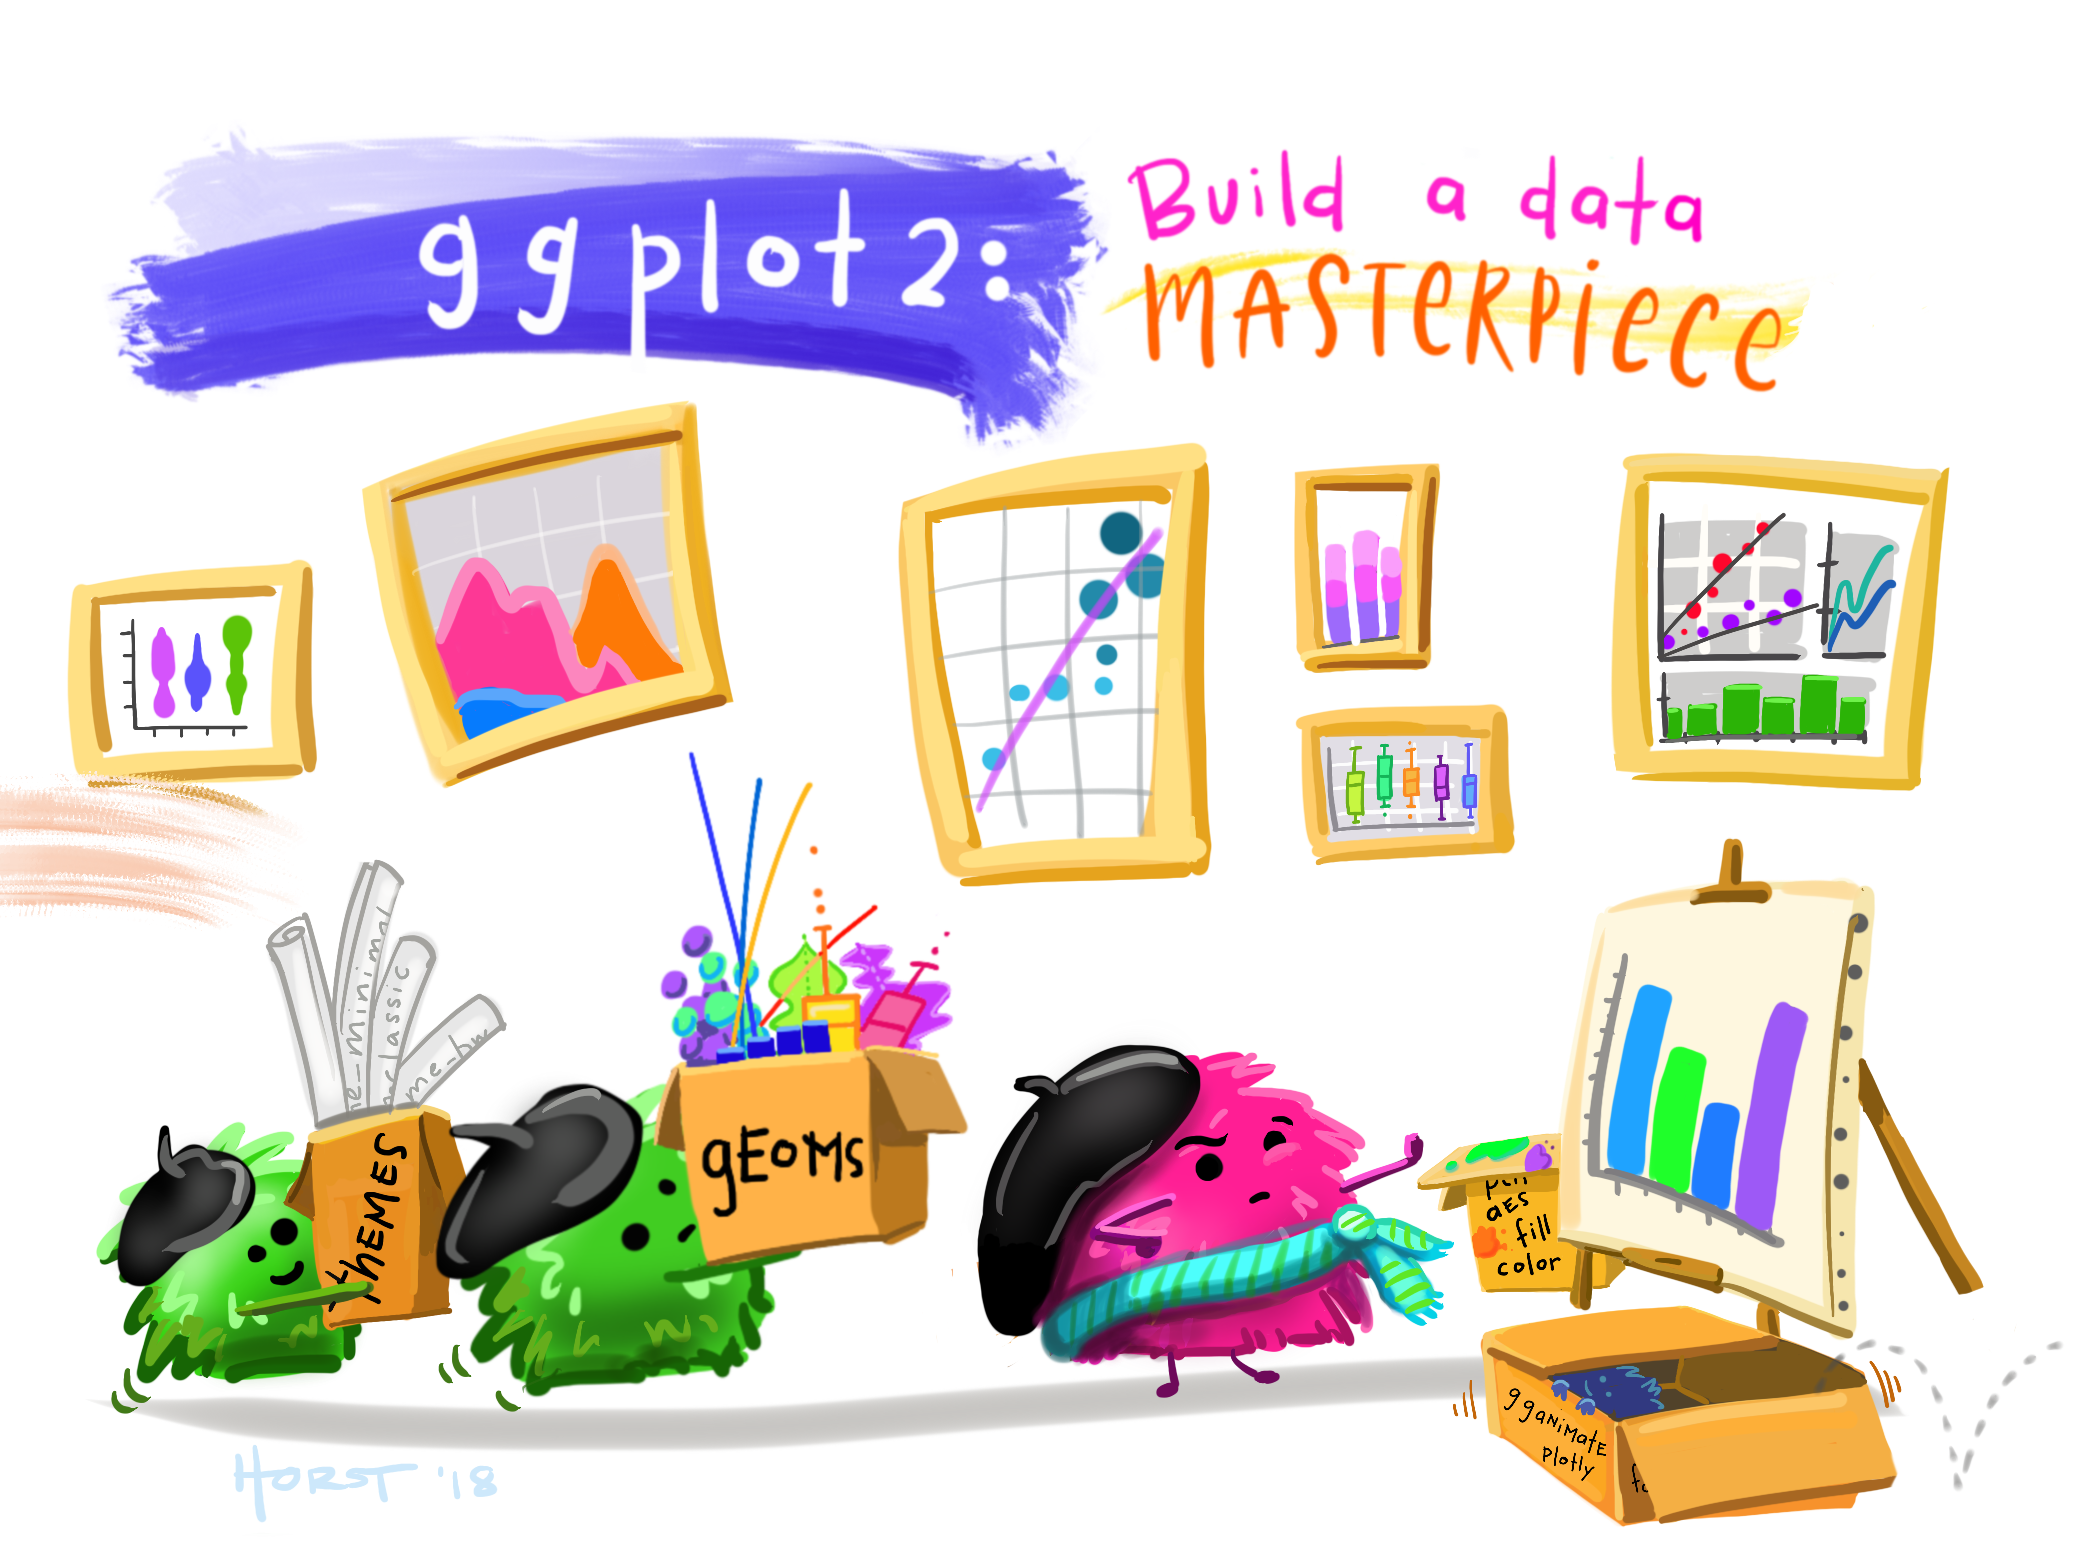
- Shoutout to Allison Horst as well. She posts the most wonderful stats/
Rartwork.
Tips for beamer
From the great Paul Goldsmith-Pinkham, some beamer tips! (pretty self-explanatory). From palettes that are color-blind friendly, to different features that beamer has and a lot of people (it me!) didn’t know. Check them out when building your next beamer presentation (click the image to see the slides). Totally worth it.

How I do it
Not that I’m a pro or anything like that, but I think my presentations do look pretty. Feel free to check out mi slides on my presentation repository, which include also the code to everything (though I will admit I need to do a better job at cleaning up the design part of the code).
Apps
Nothing to do with stats or econ or education, but some apps that are game changers:
Copilot Money: Do you know where your money is going? I thought I did, but.. nope. Copilot helps keep track of your finances, stay on budget, and actually has a daily forecast of how you’re doing wrt your monthly budget. And everything is automatic! (It even sends you notifications when one of your credit card debts goes over a %, to keep up your credit score). Truly a game changer! You can download it from the Apple Store using my code (9AKMUP) for some discounts here.
Chrome remote desktop: If you use remote desktop to access another computer or even your own laptop (and you should), you should definitely download the app. You can watch your code run from the comfort of your iPhone (or Android, not judging), and overall it has an awesome interface.
Splitwise: The best way to keep track of shared expenses, either for a trip or if you share a household. It’s integrated with Venmo, so you can settle accounts directly from the app.
Acorns: Cool app to save (and invest) some money. If you are a grad student and have trouble saving money, you can use this app to save round-ups, or even include some small weekly or monthly amount. It then invests your money according to a risk portafolio you select. PS: You can use my code to get $5!
Strava: Not much to say here. So far, best tracking app for running.